Hi Till and Katharina.
Please find attached .CSV files for the outside data, and WTB biome. Data is from midnight 07th September 2018 to midnight 08th September 2018 at 8 minute intervals.
Hope this helps.
Cheers,
Michael

Dear Michael,
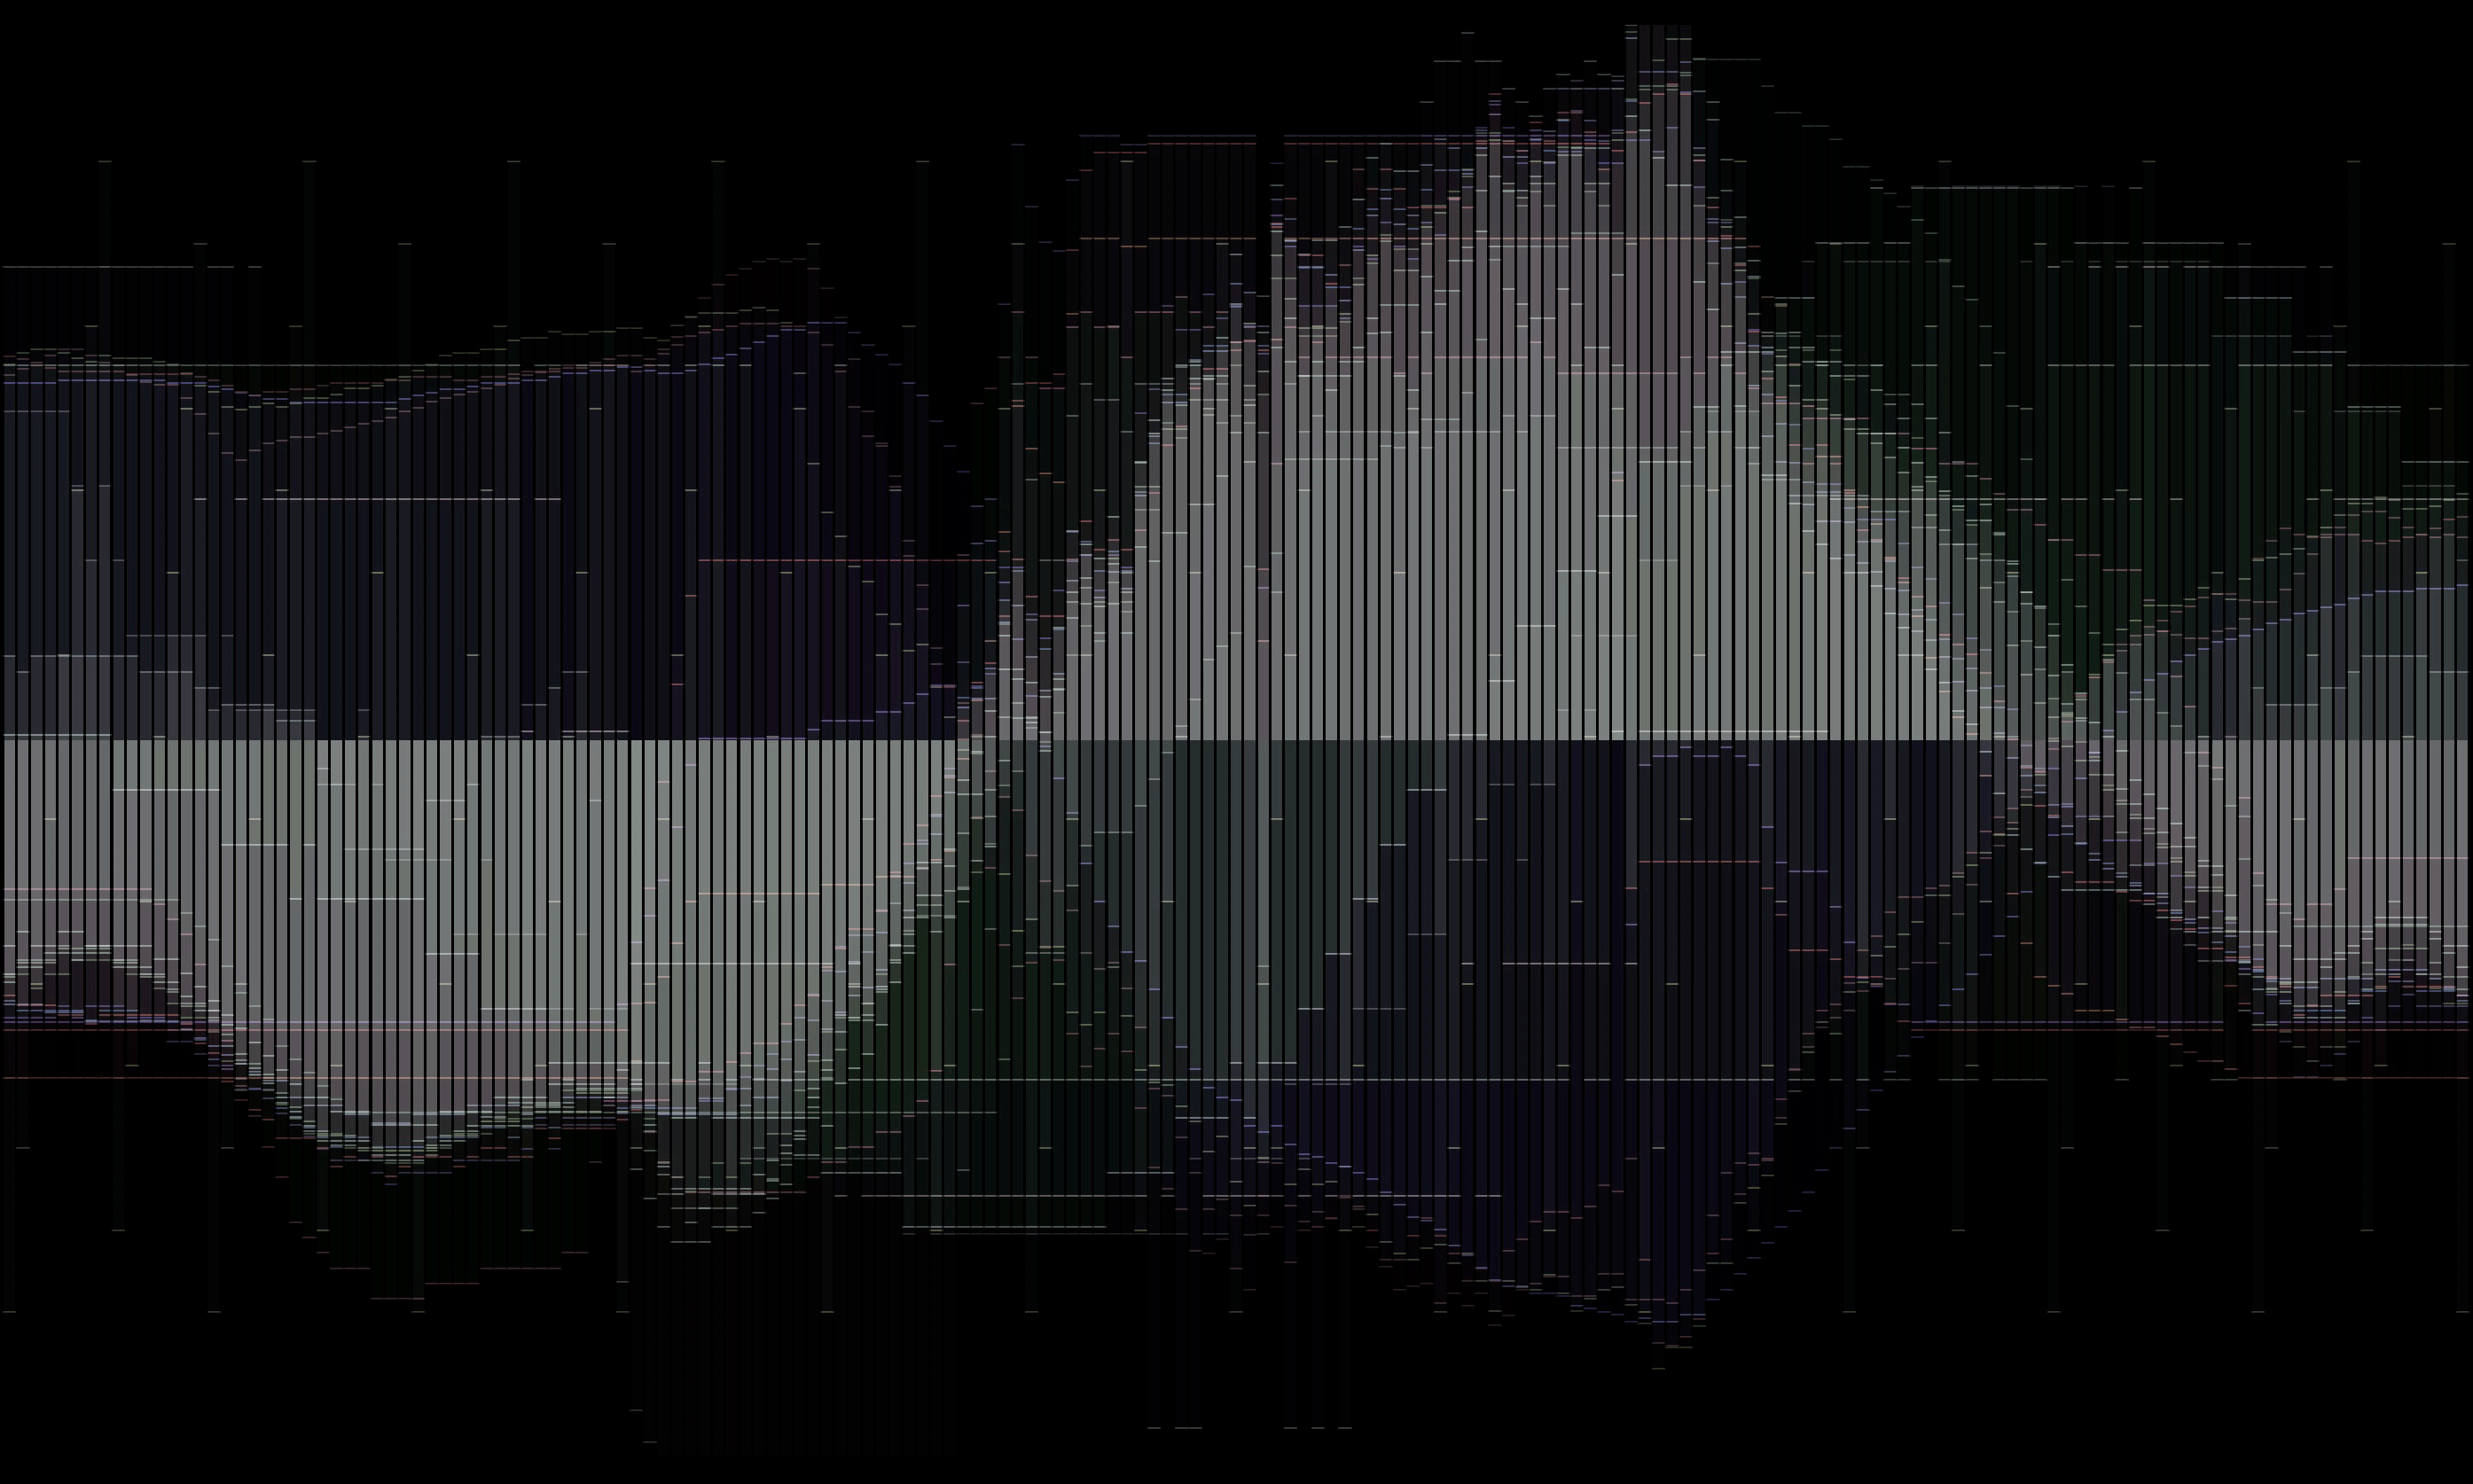
Thank you so much for the data! We parsed it with SuperCollider (our sound synthesis programming language of choice) and created a selection of sonifications. There are many ways of turning the data into sound, and for now we decided to use relatively simple approaches. Each of the sonifications we made is a “parameter mapping sonification”, i.e. that parameters of a sound synthesis engine are controlled by the data points. To hear actual changes over time, we sped up the playback from the actual recording time by a factor of 10 000. This means that the 24 hours of data you provided to us turn into 8.64 seconds of sound. To hear the periodicity of the (circadian) rhythm, we play the data 4 times, i.e. the complete sonifications are about 35 seconds long.
We hope you’ll get something out of this, if only a smile 🙂
Till & Katharina
Combined
This is the mix of all the below sonifications. Since each of them emphasises different aspects of the data, here, you can hear them all at one go.
We strongly recommend the use of headphones or a good loudspeaker setup for listening to the sounds.
Frequency
The most straight forward sonification type is a frequency mapping of all dimensions. This means that the variation in the data collected by one sensor (e.g. hl_temp_F) results in the change of the pitch of one oscillator. There are 24 oscillators, one for each sensor/actor.
Coloured Noise
A variation of the above, using a bandpass filter on noise sources. The sound is much easier on the ears and artifacts from overlapping periodic waveforms are minimised.
Amplitude
The maybe second-most straight forward sonification type is an amplitude mapping of all dimensions. This means that the variation in the data collected by one sensor (e.g. hl_temp_F) results in the change of the amplitude of one oscillator. There are 24 oscillators, one for each sensor/actor. Each oscillator has a fixed frequency and position in the stereo field.
Amplitude Trig
This sonification is a variation of the previous: it adds a little “bumb” in the amplitude, each time an update of the data arrives, this helps to understand the granularity of the data collection and marks possible artefacts emerging from the sampling rate of the data itself.
Both amplitude sonifications have a slight reverb added, emphasising phase shifting which should be noticeable when listening to them with headphones.
Further details
If you are now curious about data sonification, you might want to look into this (free) sonification handbook. It has lots of information on how to approach the theme of data sonification and helps to interpret the data.
Synthesis definitions
Each sonification type has its own synthesis engine. Here is their definition:
Ranges
For the frequency mapping sonification, we set up a data structure that contains information on the range of frequencies in which each data dimension will be mapped.
Player
Last not least, there is the player, a Routine that iterates through the rows of data, adjusting parameters for the synthesis engine accordingly.
